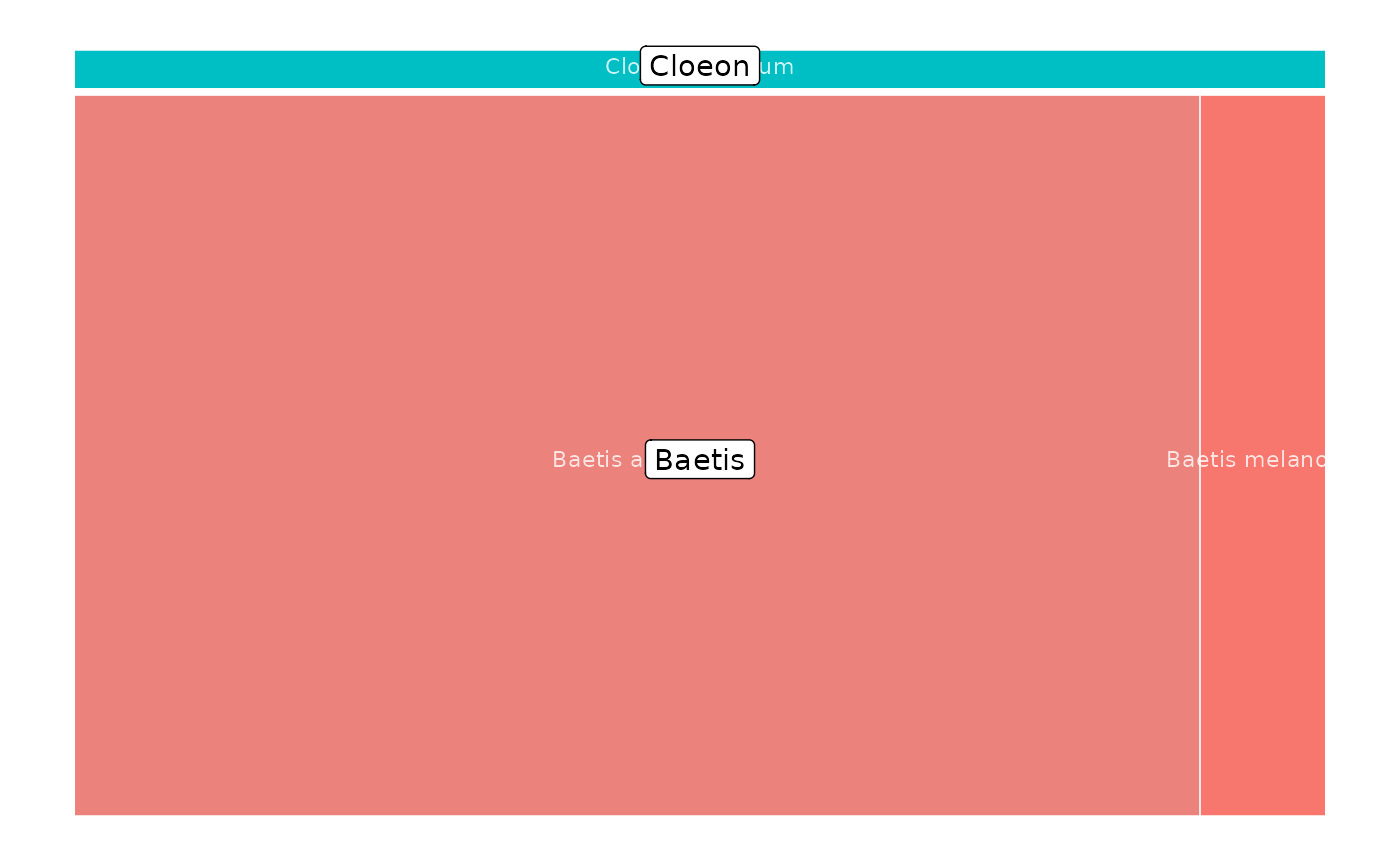
Represent the hierarchical structure of the taxonomic information of a reference database as a set of nested rectangles (treemap).
refdb_plot_tax_treemap(x, cols = NULL, freq_labels = c(0.01, 0.003))Arguments
- x
a reference database.
- cols
a vector of column names referring to taxonomic levels to include in the treemap. If not provided (
NULL) the function tries to find a relevant subset of columns.- freq_labels
a numeric vector of length two to adjust the number of printed labels (see Details).
Only the columns provided in the
colsargument are represented in the treemap. Large labels are printed for the highest rank, while light text labels are printed for the lowest rank Intermediate ranks are drawn but their names are not shown.The number of labels printed are determined by
freq_labels. The first value gives the threshold for the highest rank (large labels) and the second value gives the threshold for the lowest rank (light text labels).The underlying graph is computed using the non-exported function
igraph_from_taxo.
Value
A ggplot2 (ggraph) object. This means the plot can be further customized using ggplot2 compatible functions.
Examples
lib <- read.csv(system.file("extdata", "baetidae_bold.csv", package = "refdb"))
lib <- refdb_set_fields_BOLD(lib)
refdb_plot_tax_treemap(lib)
#> Selected columns: genus_name, species_name
#> Non-leaf weights ignored
#> Warning: Removed 3 rows containing missing values or values outside the scale range
#> (`geom_text()`).
#> Warning: Removed 4 rows containing missing values or values outside the scale range
#> (`geom_label()`).