Represent the hierarchical structure of the taxonomic information of a reference database as a tree.
refdb_plot_tax_tree(
  x,
  leaf_col = NULL,
  color_col = NULL,
  freq_labels = 0,
  expand_plot = 0.5
)
Arguments
- x
a reference database.
- leaf_col
a column name referring to the taxonomic level for the leaves of the tree. If not provided (
NULL) the function tries to find a relevant level.- color_col
a column name referring to the taxonomic level for the color of the leaves (must be higher or equal to the level of
leaf_col). If not provided (NULL) the function tries to find a relevant level.- freq_labels
a numeric value to adjust the number of printed labels (minimum frequency). Default is zero which means all non-NA labels are printed.
- expand_plot
a value to expand the limits of the plot. Useful if the labels are too long.
Value
A ggplot2 (ggraph) object. This means the plot can be further customized using ggplot2 compatible functions.
Details
The underlying graph is computed using the non-exported function
igraph_from_taxo.
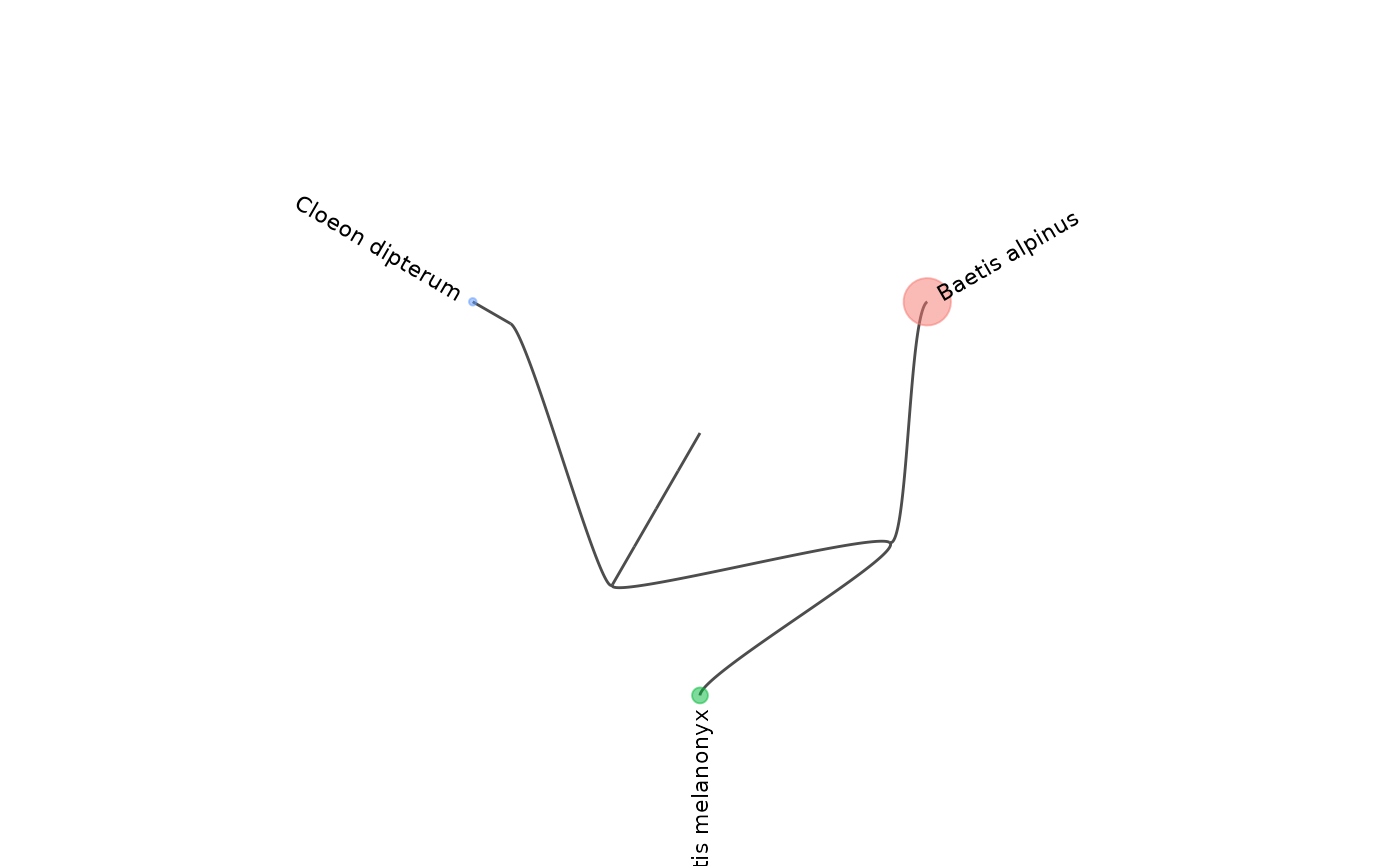
Examples
lib <- read.csv(system.file("extdata", "baetidae_bold.csv", package = "refdb"))
lib <- refdb_set_fields_BOLD(lib)
refdb_plot_tax_tree(lib)
#> Selected rank columns for the tree: phylum_name, class_name, order_name, family_name, subfamily_name, genus_name, species_name
#> Selected rank column for the color: species_name
#> Warning: There was 1 warning in `dplyr::group_by()`.
#> ℹ In argument: `dplyr::across()`.
#> Caused by warning:
#> ! Using `across()` without supplying `.cols` was deprecated in dplyr 1.1.0.
#> ℹ Please supply `.cols` instead.
#> Warning: Removed 7 rows containing missing values or values outside the scale range
#> (`geom_text()`).