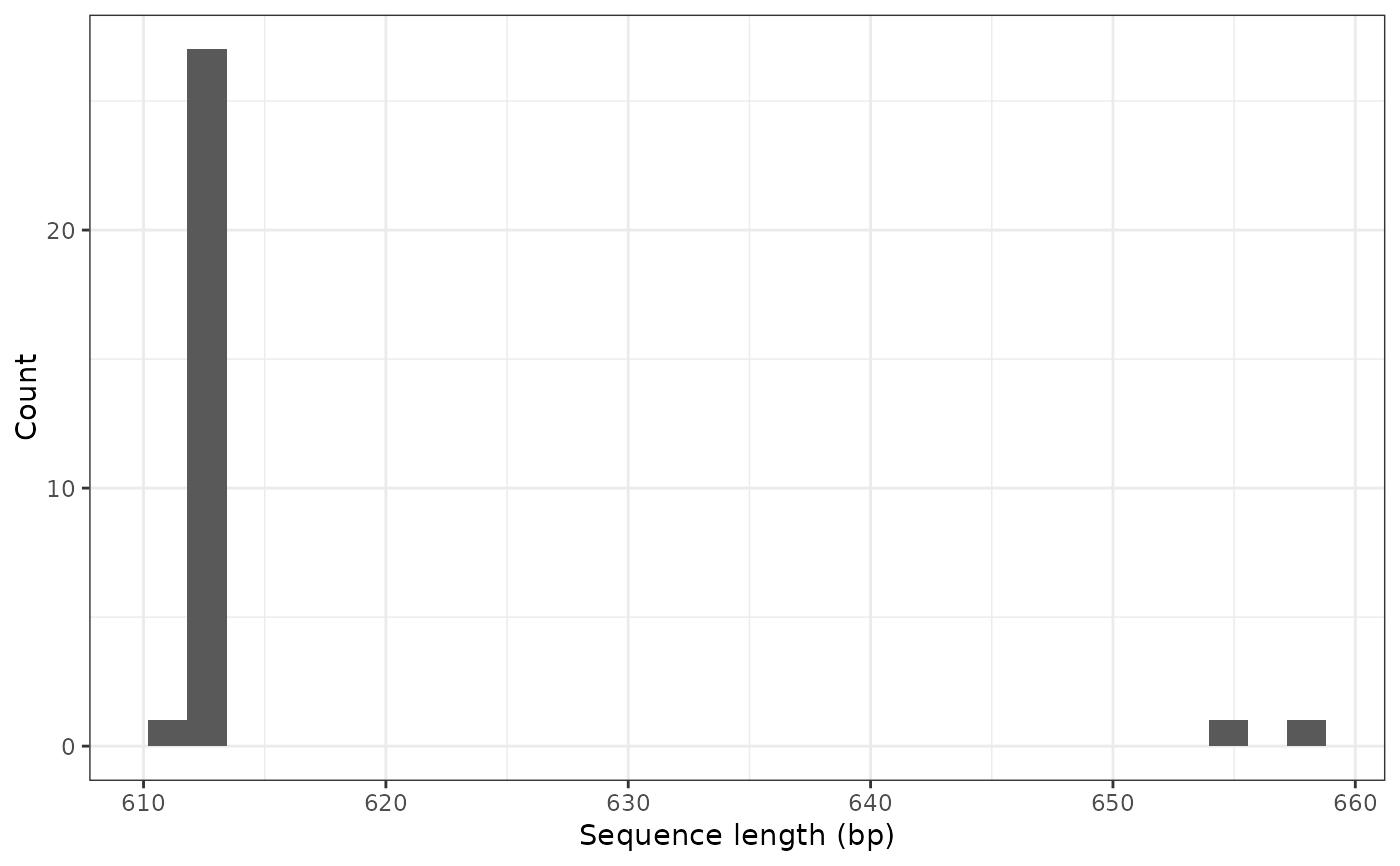
Plot an histogram of sequence lengths
refdb_plot_seqlen_hist(x, remove_gaps = TRUE)Arguments
Value
A ggplot object. This means the plot can be further customized using ggplot2 compatible functions.
Examples
lib <- read.csv(system.file("extdata", "baetidae_bold.csv", package = "refdb"))
lib <- refdb_set_fields_BOLD(lib)
refdb_plot_seqlen_hist(lib)
#> `stat_bin()` using `bins = 30`. Pick better value with `binwidth`.